I. Introduction
Regression analysis is a cornerstone technique in the realm of data science, pivotal for uncovering patterns within data and making informed predictions across various domains. While linear regression is widely recognized and frequently utilized, logistic regression stands as another critical method, albeit for different purposes.
This article aims to illuminate the fascinating dynamics of linear and logistic regression, highlighting not only their similarities but, crucially, their differences. Both techniques, though rooted in regression analysis, are tailored for distinct applications and possess unique characteristics.
For data analysts, researchers, and practitioners, grasping these distinctions is essential. It empowers them to choose the right regression technique tailored to their specific challenges, whether predicting continuous outcomes like house prices or classifying binary outcomes such as identifying spam emails.
In the sections that follow, we will unravel the complexities and nuances of linear and logistic regression. We begin by laying the groundwork with linear regression, exploring its core assumptions and mathematical underpinnings. Subsequently, we will explore logistic regression, detailing its unique attributes and how it diverges from linear regression.
Through practical examples and real-world case studies, we will illustrate the application of these techniques, providing clarity on their specific uses and advantages.
We will delve into the models and assumptions that differentiate linear and logistic regression. This includes examining the linear relationship assumption in linear regression and the consequences of its violation, as well as understanding how logistic regression uses the logit transformation to handle probabilities and binary outcomes.
Interpreting regression results is another critical area we will cover. We will discuss how the coefficients from linear and logistic regression models offer different insights, emphasizing their unique interpretations.
Finally, we will address the practical implementation of both regression techniques using popular statistical software. We will also touch on recent advancements and best practices in the field, equipping readers with the knowledge to excel in regression analysis.
By the end of this article, you will have a comprehensive understanding of linear and logistic regression, enabling you to tackle diverse data analysis challenges and make well-informed decisions when selecting the appropriate regression technique for your needs. Let's embark on this enlightening journey into the world of linear and logistic regression.
II. Understanding Linear Regression
Linear regression is a cornerstone technique in statistical modeling, designed to establish a linear relationship between a dependent variable and one or more independent variables. It is instrumental in predicting numerical outcomes and understanding the influence of independent variables on the target variable.
Definition and Purpose
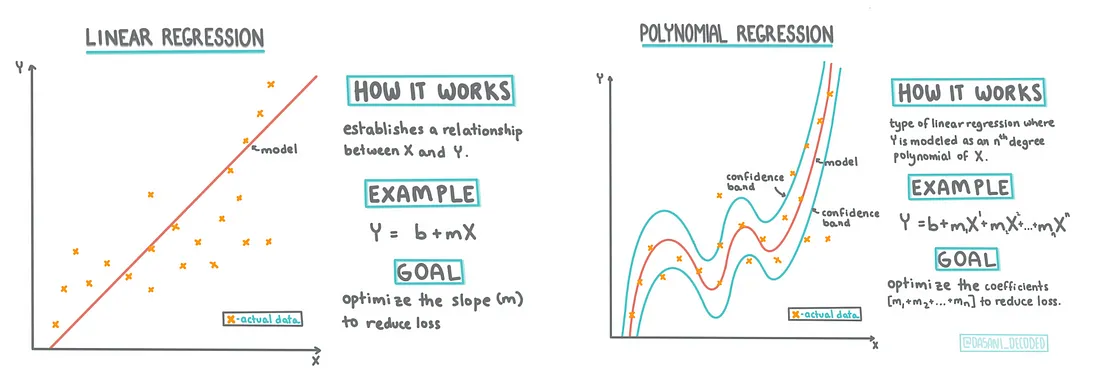
Linear regression aims to model the relationship between a dependent variable (often referred to as the response variable) and one or more independent variables (known as predictor variables or features). The primary objective is to determine the best-fitting line or hyperplane that minimizes the sum of squared differences between the predicted and actual values. This line or hyperplane facilitates predictions and elucidates the relationships between variables.
Assumptions
To ensure the validity and reliability of the model, linear regression relies on several key assumptions:
- Linearity: The relationship between the independent and dependent variables should be linear.
- Independence of Errors: The residuals (errors) should be independent.
- Homoscedasticity: The variance of residuals should be constant across all levels of the independent variables.
- Normality of Errors: The residuals should be normally distributed.
It is crucial to verify these assumptions before interpreting the results of a linear regression analysis.
Mathematical Foundations
The mathematical underpinnings of linear regression are based on the principle of ordinary least squares (OLS) estimation. OLS estimates the regression coefficients that minimize the sum of squared differences between the observed and predicted values. These coefficients represent the slope and intercept of the regression line, indicating the relationship and the magnitude of influence between the independent and dependent variables.
Applications
Linear regression is widely applied across various fields. It enables the prediction of numerical values based on existing data and identifies significant predictors affecting the target variable. Some common applications include:
- Predicting housing prices based on features such as square footage, number of bedrooms, and location.
- Forecasting sales figures based on marketing expenditures.
- Estimating the impact of education and experience on salary levels.
Understanding the fundamentals of linear regression is essential for building a robust foundation in regression analysis. In the following sections, we will delve into the intricacies of logistic regression and explore how it diverges from linear regression in terms of purpose, mathematical model, and interpretation of results.
III. Understanding Logistic Regression

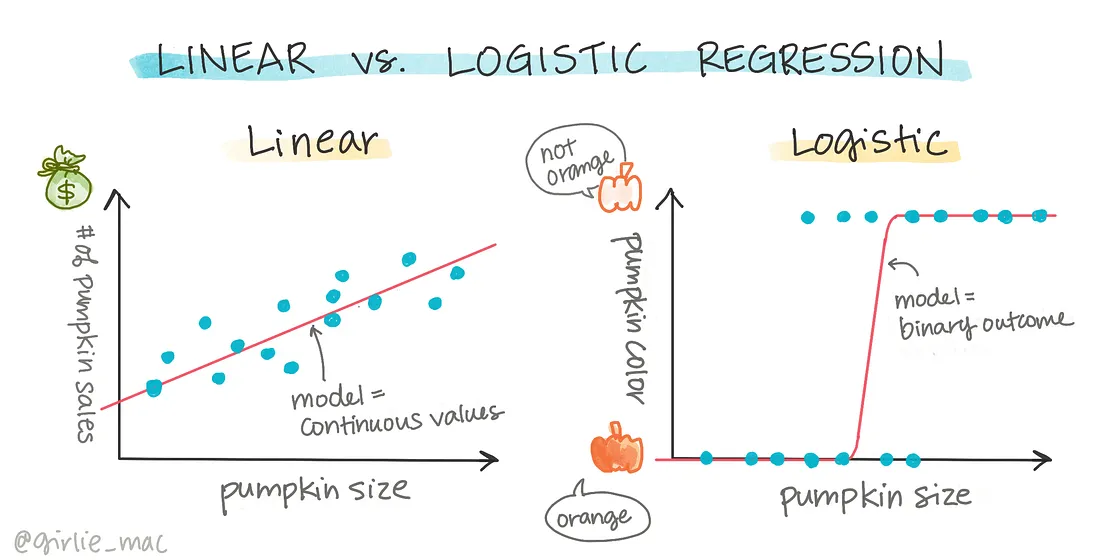
While linear regression excels at predicting numerical values, logistic regression is tailored for binary classification problems. It models the probability of an event occurring, enabling predictions based on that probability. In this section, we will explore the nuances of logistic regression and highlight its key differences from linear regression.
Definition and Purpose
Logistic regression is a statistical technique used to model the relationship between a binary dependent variable (often referred to as the outcome variable) and one or more independent variables. Unlike linear regression, which predicts continuous values, logistic regression estimates the probability of the outcome variable belonging to a specific category or class.
Contrast with Linear Regression
One of the primary differences between linear and logistic regression lies in their purposes. While linear regression predicts continuous numerical values, logistic regression is designed for binary classification tasks. Logistic regression is ideal for scenarios where the dependent variable has two possible outcomes, such as yes/no, true/false, or 0/1.
Mathematical Model
The mathematical model of logistic regression differs from that of linear regression. Logistic regression applies a logit transformation to model the log-odds of the probability of the outcome variable. The logit function, also known as the sigmoid function, maps the linear combination of the independent variables to a value between 0 and 1, representing the probability of the outcome variable belonging to the positive class.
Applications
Logistic regression is widely used across various fields for binary classification tasks. Common applications include:
- Predicting customer churn.
- Determining the likelihood of a patient having a particular disease based on medical indicators.
- Classifying emails as spam or legitimate.
Logistic regression can also be extended to multi-class classification problems using techniques like one-vs-rest or softmax regression.
Understanding the unique characteristics and purpose of logistic regression is crucial for determining its appropriate usage in different scenarios. In the following sections, we will explore the differences in model assumptions and the interpretation of results between linear and logistic regression, providing further insights into their distinct nature.
IV. Differences in Model and Assumptions
While both linear regression and logistic regression are types of regression analysis, they differ significantly in their underlying models and assumptions. In this section, we will compare and contrast the models and assumptions of linear and logistic regression, highlighting their distinct characteristics.
Model Assumptions in Linear Regression
Linear regression relies on several key assumptions to ensure the validity of the model and the reliability of the results:
- Linearity: Assumes a linear relationship between the dependent variable and the independent variables.
- Independence of Errors: The residuals (errors) should be independent.
- Homoscedasticity: The variance of residuals should be constant across all levels of the independent variables.
- Normality of Errors: The residuals should be normally distributed.
Violating these assumptions can affect the accuracy and interpretability of the results.
Linear Relationships in Linear Regression
Linear regression assumes a linear relationship between the dependent variable and the independent variables. This implies that a constant change in the independent variable leads to a constant change in the dependent variable. However, in cases where a non-linear relationship exists, transformations or non-linear modeling techniques may be employed to capture the underlying patterns effectively.
Model Assumptions in Logistic Regression
Logistic regression has different assumptions compared to linear regression:
- No Linearity Assumption: The linearity assumption is not required in logistic regression since the relationship between the independent variables and the log-odds of the outcome variable is modeled through the logit transformation.
- Independence of Observations: Logistic regression assumes that the observations are independent of each other.
Logit Transformation in Logistic Regression
In logistic regression, the logit transformation is used to map the linear combination of the independent variables to a value between 0 and 1. This transformed value represents the probability of the outcome variable belonging to the positive class. Unlike linear regression, logistic regression allows us to model probabilities and binary outcomes effectively.
Understanding the differences in model assumptions between linear and logistic regression is essential for choosing the appropriate technique for a given problem. In the following section, we will explore the interpretation of results in both regression techniques, shedding light on how the coefficients are understood and their implications.
V. Interpretation of Results
Interpreting the results of regression analysis is a crucial step in understanding the relationship between variables and deriving meaningful insights. In this section, we will explore how the interpretation of results differs between linear and logistic regression, shedding light on the unique implications of their coefficients.
Interpretation of Results in Linear Regression
In linear regression, the coefficients associated with the independent variables represent the change in the dependent variable for a unit change in the corresponding independent variable, while holding other variables constant. These coefficients indicate the direction (positive or negative) and magnitude of the relationship between the independent and dependent variables. Additionally, the intercept term represents the expected value of the dependent variable when all independent variables are zero.
Interpretation of Results in Logistic Regression
Interpreting the results in logistic regression differs from linear regression due to the use of the logit transformation. In logistic regression, the coefficients represent the change in the log-odds of the outcome variable for a unit change in the corresponding independent variable, while holding other variables constant. To interpret the coefficients, we can exponentiate them to obtain odds ratios, which indicate the multiplicative change in the odds of the outcome for a one-unit increase in the independent variable.
Understanding Odds Ratios
In logistic regression, odds ratios provide insights into the relationship between the independent variables and the likelihood of the outcome variable belonging to the positive class. An odds ratio greater than 1 indicates that an increase in the independent variable’s value leads to higher odds of the positive outcome, while an odds ratio less than 1 suggests a decrease in the odds of the positive outcome. Additionally, odds ratios close to 1 indicate a weaker or negligible impact of the independent variable on the outcome.
Confidence Intervals and Significance
Similar to linear regression, logistic regression results include confidence intervals and p-values to assess the significance of the coefficients. A statistically significant coefficient implies that the independent variable has a significant impact on the outcome variable, while a non-significant coefficient suggests a lack of evidence for a relationship.
Interpreting the results of regression analysis allows us to gain insights into the relationships between variables and draw meaningful conclusions. Understanding the unique interpretations of coefficients in linear and logistic regression enables us to make informed decisions and draw accurate inferences from the analysis. In the next section, we will provide practical examples and case studies to illustrate the distinct applications of linear and logistic regression in real-world scenarios.
VI. Practical Examples
To gain a deeper understanding of the distinct applications of linear and logistic regression, let's explore practical examples and case studies that highlight their usage in real-world scenarios. By examining these examples, we can grasp how linear and logistic regression are employed to address specific challenges and derive valuable insights.
Linear Regression Example
Consider a real estate agency aiming to predict housing prices based on various features such as square footage, number of bedrooms, and location. Linear regression can be applied to create a model that estimates the price of a house based on these variables. By analyzing the coefficients obtained from the linear regression model, we can determine which features have a significant impact on the house price and understand the direction of that impact.
Logistic Regression Example
Imagine a healthcare provider tasked with predicting the likelihood of a patient developing a particular disease based on medical indicators such as age, blood pressure, and cholesterol levels. Logistic regression can be utilized to build a model that estimates the probability of a patient having the disease. By examining the odds ratios derived from the logistic regression model, we can identify the most influential factors that contribute to the likelihood of disease occurrence.
These examples illustrate the distinct purposes and applications of linear and logistic regression. While linear regression is suitable for predicting numerical values, logistic regression excels in binary classification tasks, such as disease prediction, spam email detection, or customer churn analysis. Understanding when to employ each technique enables us to make accurate predictions and informed decisions.
In the conclusion, we will summarize the key points discussed throughout the article and emphasize the importance of understanding the distinctions between linear and logistic regression for data analysis.
VII. Conclusion
In this article, we have explored the similarities and differences between linear and logistic regression, two fundamental techniques in regression analysis. While both approaches fall under the umbrella of regression, they serve distinct purposes and are suited for different types of problems.
Linear regression excels at predicting numerical values and understanding the relationship between independent and dependent variables. By assuming linearity and employing ordinary least squares estimation, linear regression provides insights into the impact of predictors on the outcome variable.
On the other hand, logistic regression is specifically designed for binary classification tasks. By employing the logit transformation and modeling the probability of the outcome variable belonging to a specific class, logistic regression enables effective classification and prediction in scenarios such as disease diagnosis, customer churn analysis, and spam email detection.
Understanding the differences in model assumptions, interpretation of results, and practical applications of linear and logistic regression is crucial for data analysts, researchers, and practitioners. By appropriately selecting the regression technique that aligns with the problem at hand, one can derive accurate insights and make informed decisions.
We have also discussed recent advancements and best practices in regression analysis, including regularization techniques, model selection and validation, handling non-linearity, dealing with missing data, and interpreting complex models. By staying updated with these advancements and adhering to best practices, we can ensure the reliability and accuracy of regression models.
As regression analysis continues to evolve, it is essential to keep learning, exploring new techniques, and staying informed about emerging trends in the field. By doing so, we equip ourselves with the tools and knowledge needed to tackle complex data analysis challenges and derive meaningful insights from regression models.
In conclusion, linear and logistic regression may share some similarities, but their purposes and applications set them apart. Embracing the nuances of each technique empowers us to unlock the full potential of regression analysis and make data-driven decisions in various domains. So, whether it's predicting housing prices or classifying spam emails, understanding the distinctions between linear and logistic regression is key to harnessing the power of regression analysis.

Thanks for reading! My name is Arthur, and I love writing about AI, data science, and the intersection between mathematics and programming.
I've been coding and exploring math for years, and I'm always learning something new—whether it's self-hosting tools in my homelab, experimenting with machine learning models, or diving into statistical methods.
I share my knowledge here because I know how valuable clear, hands-on resources can be, especially when you're just getting started or exploring something deeply technical.
If you have any questions or just want to chat, feel free to reach out to me on LinkedIn or GitHub.
I hope you enjoyed this post and learned something useful. If you did, consider sharing it—it really helps and means a lot!